Visual Intelligence
Software
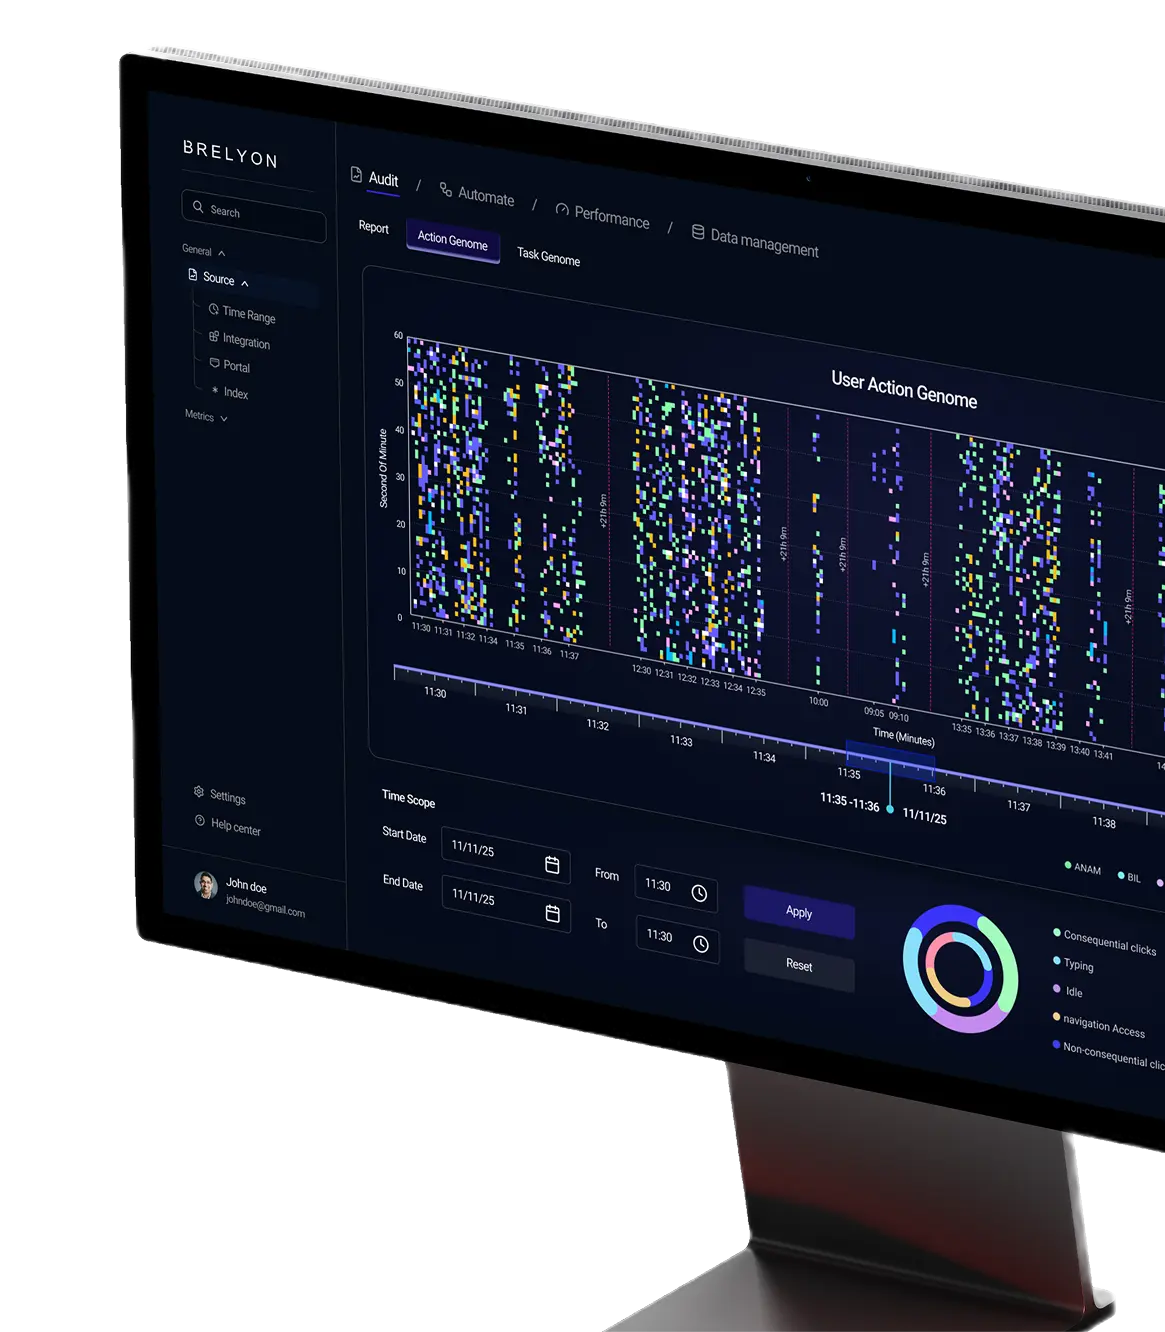
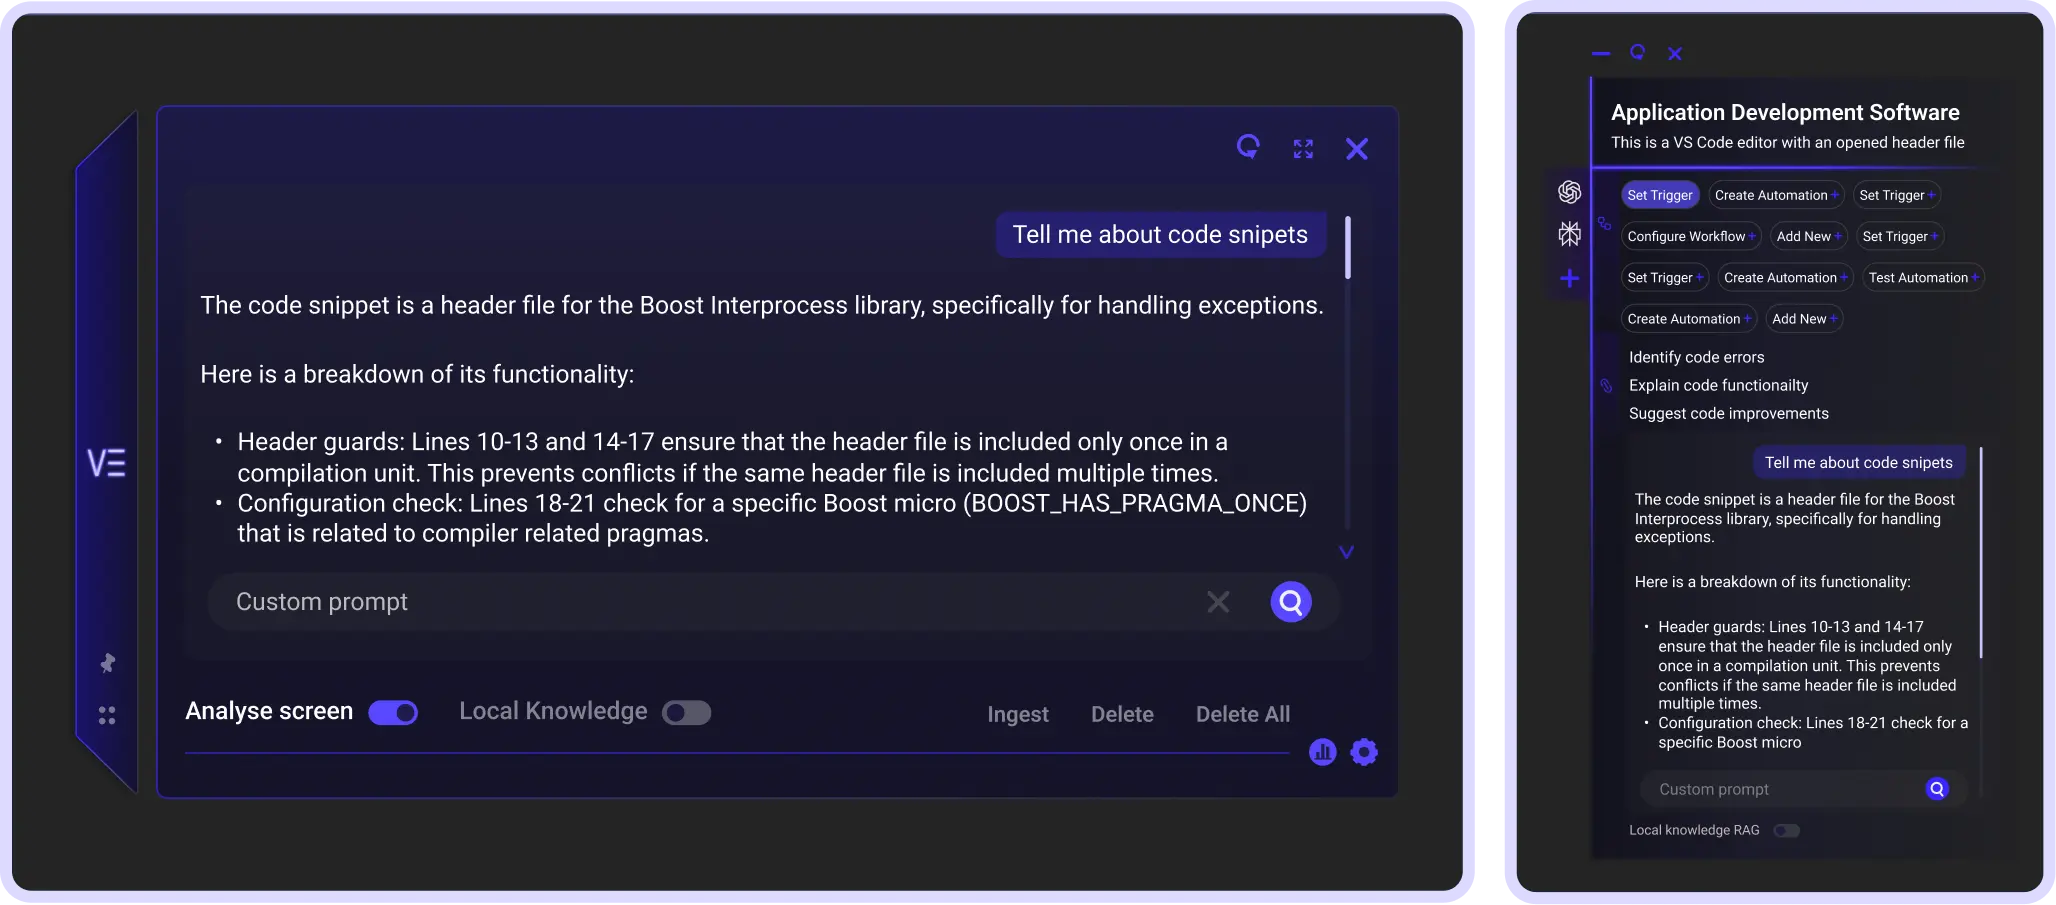
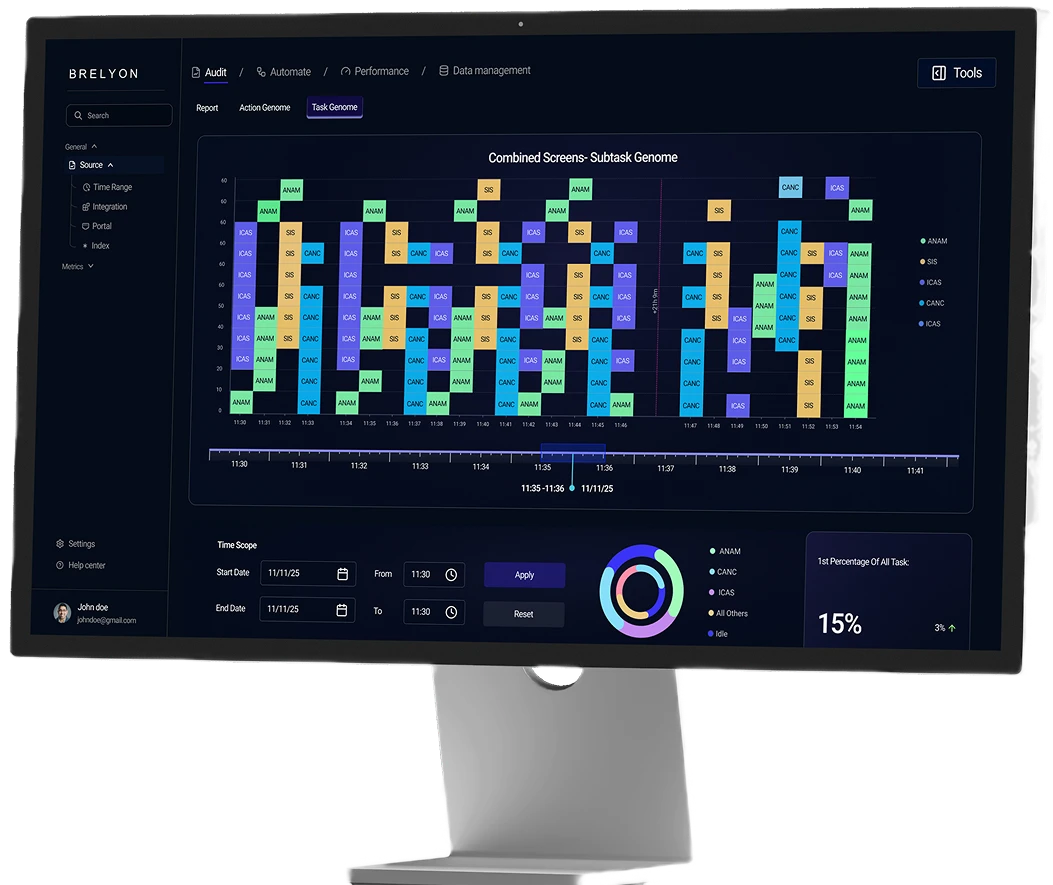
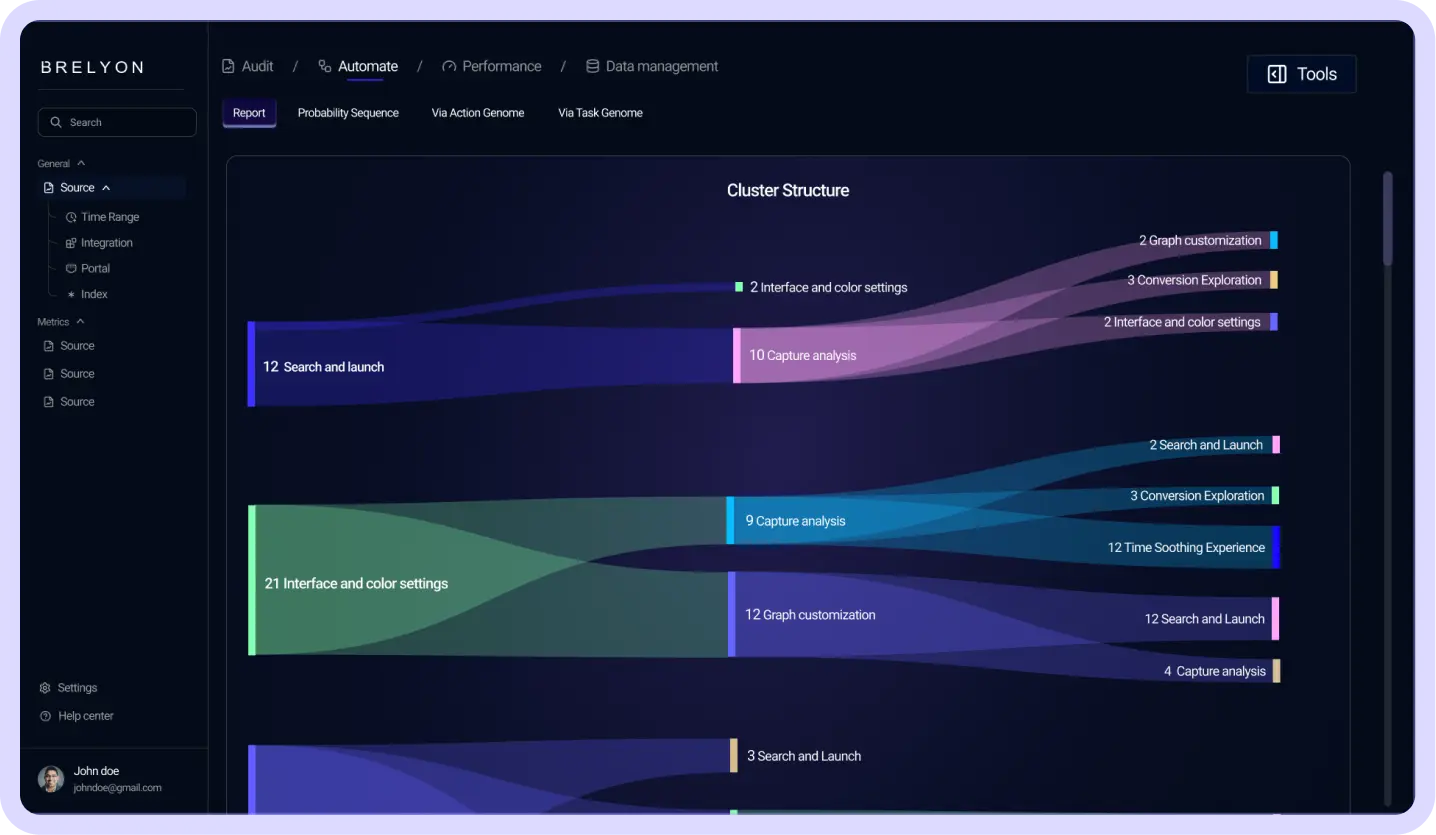
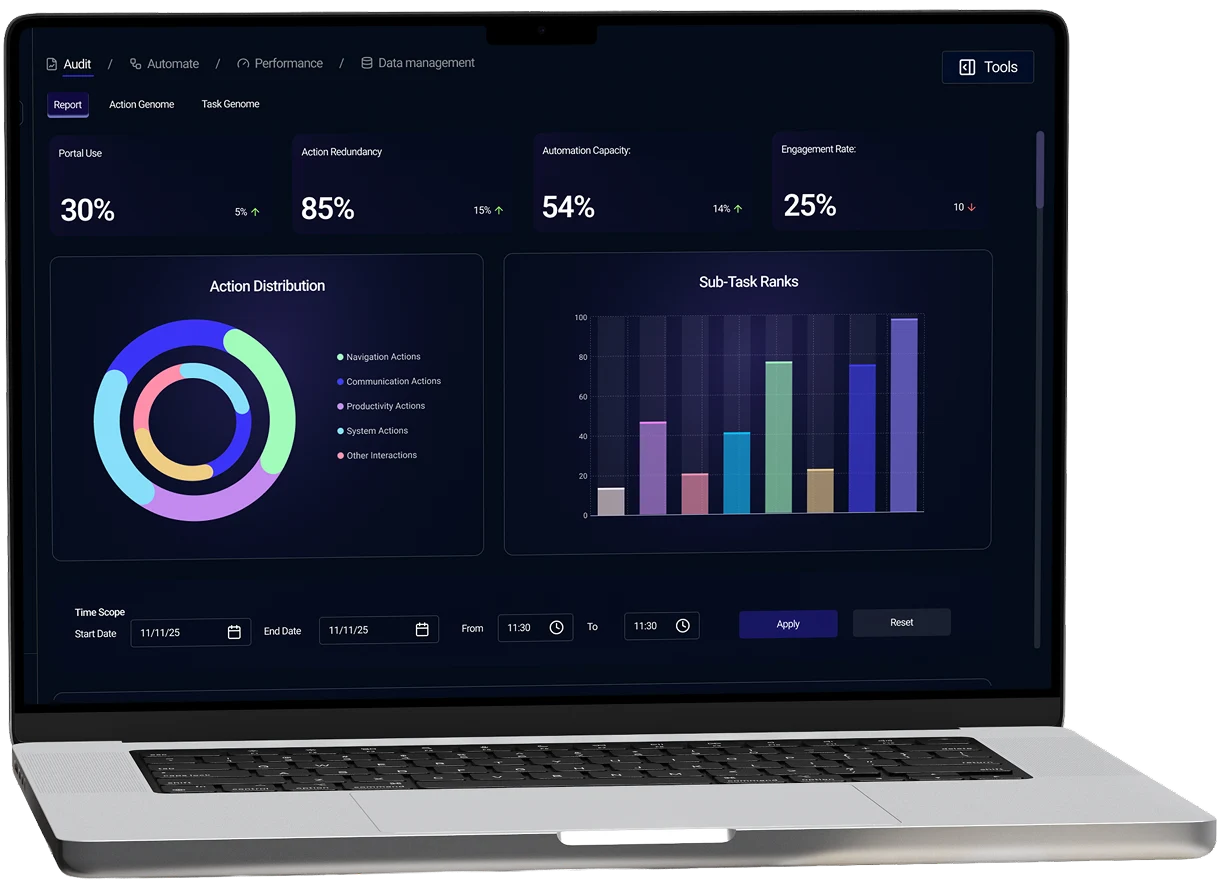
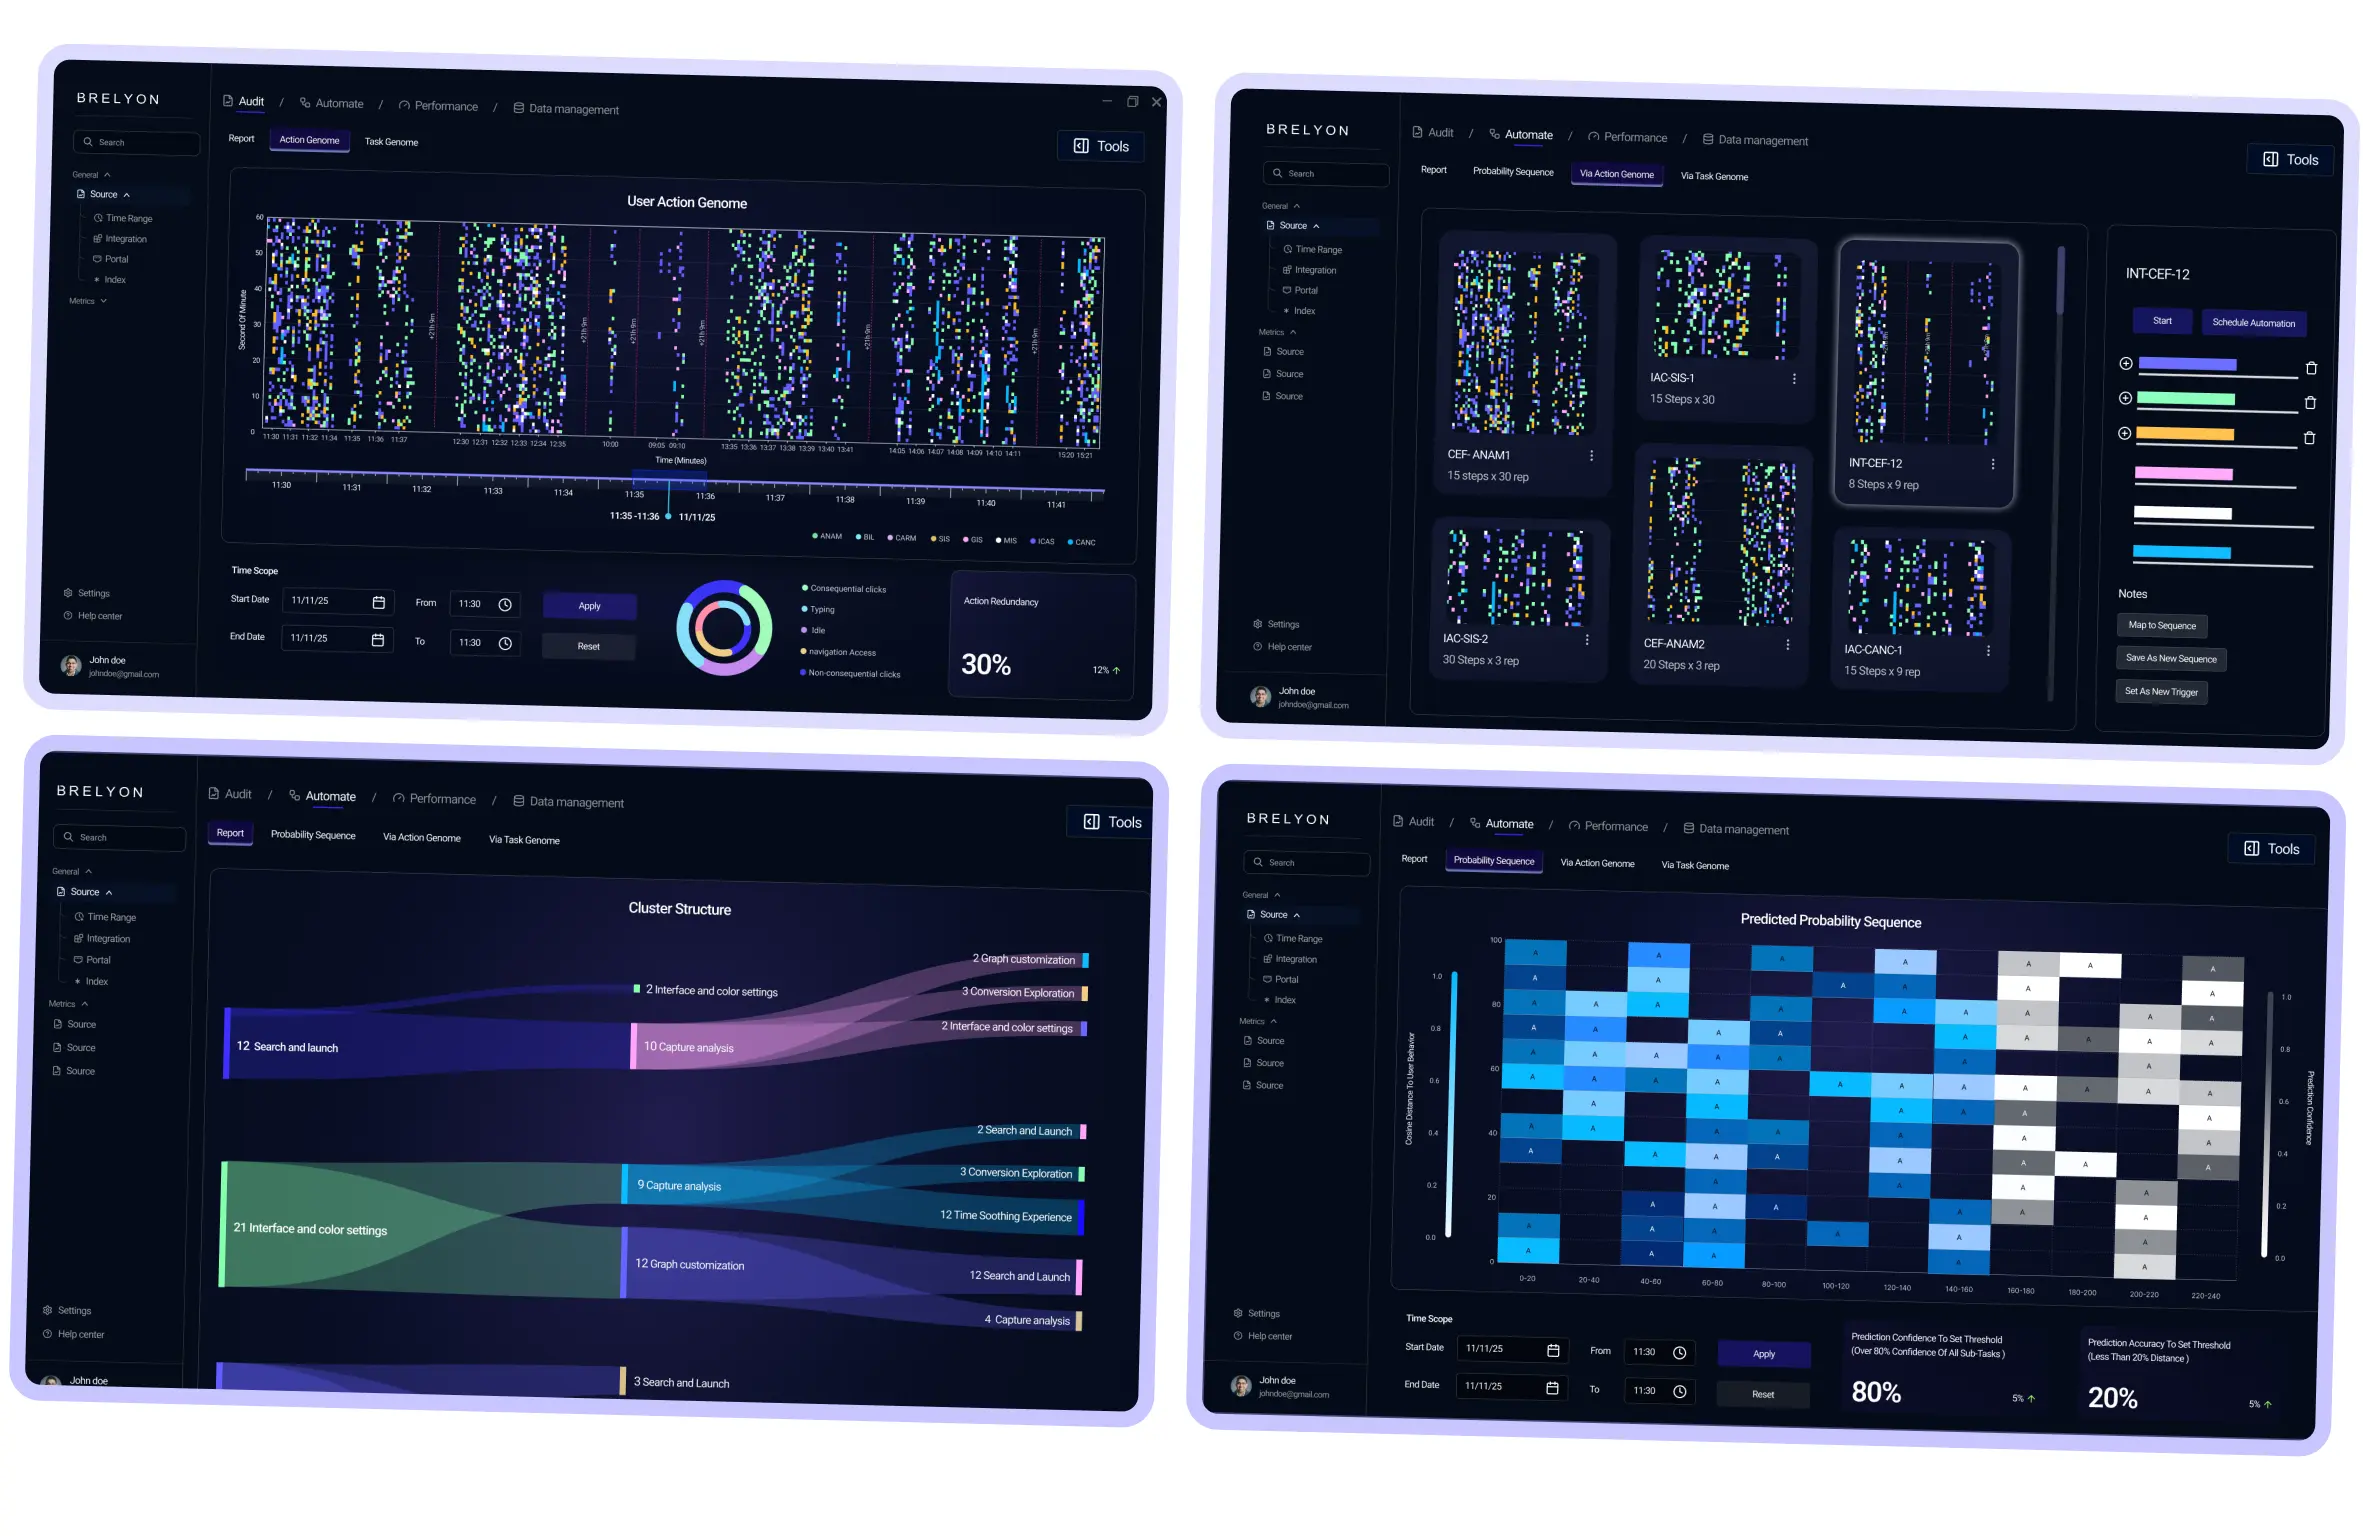
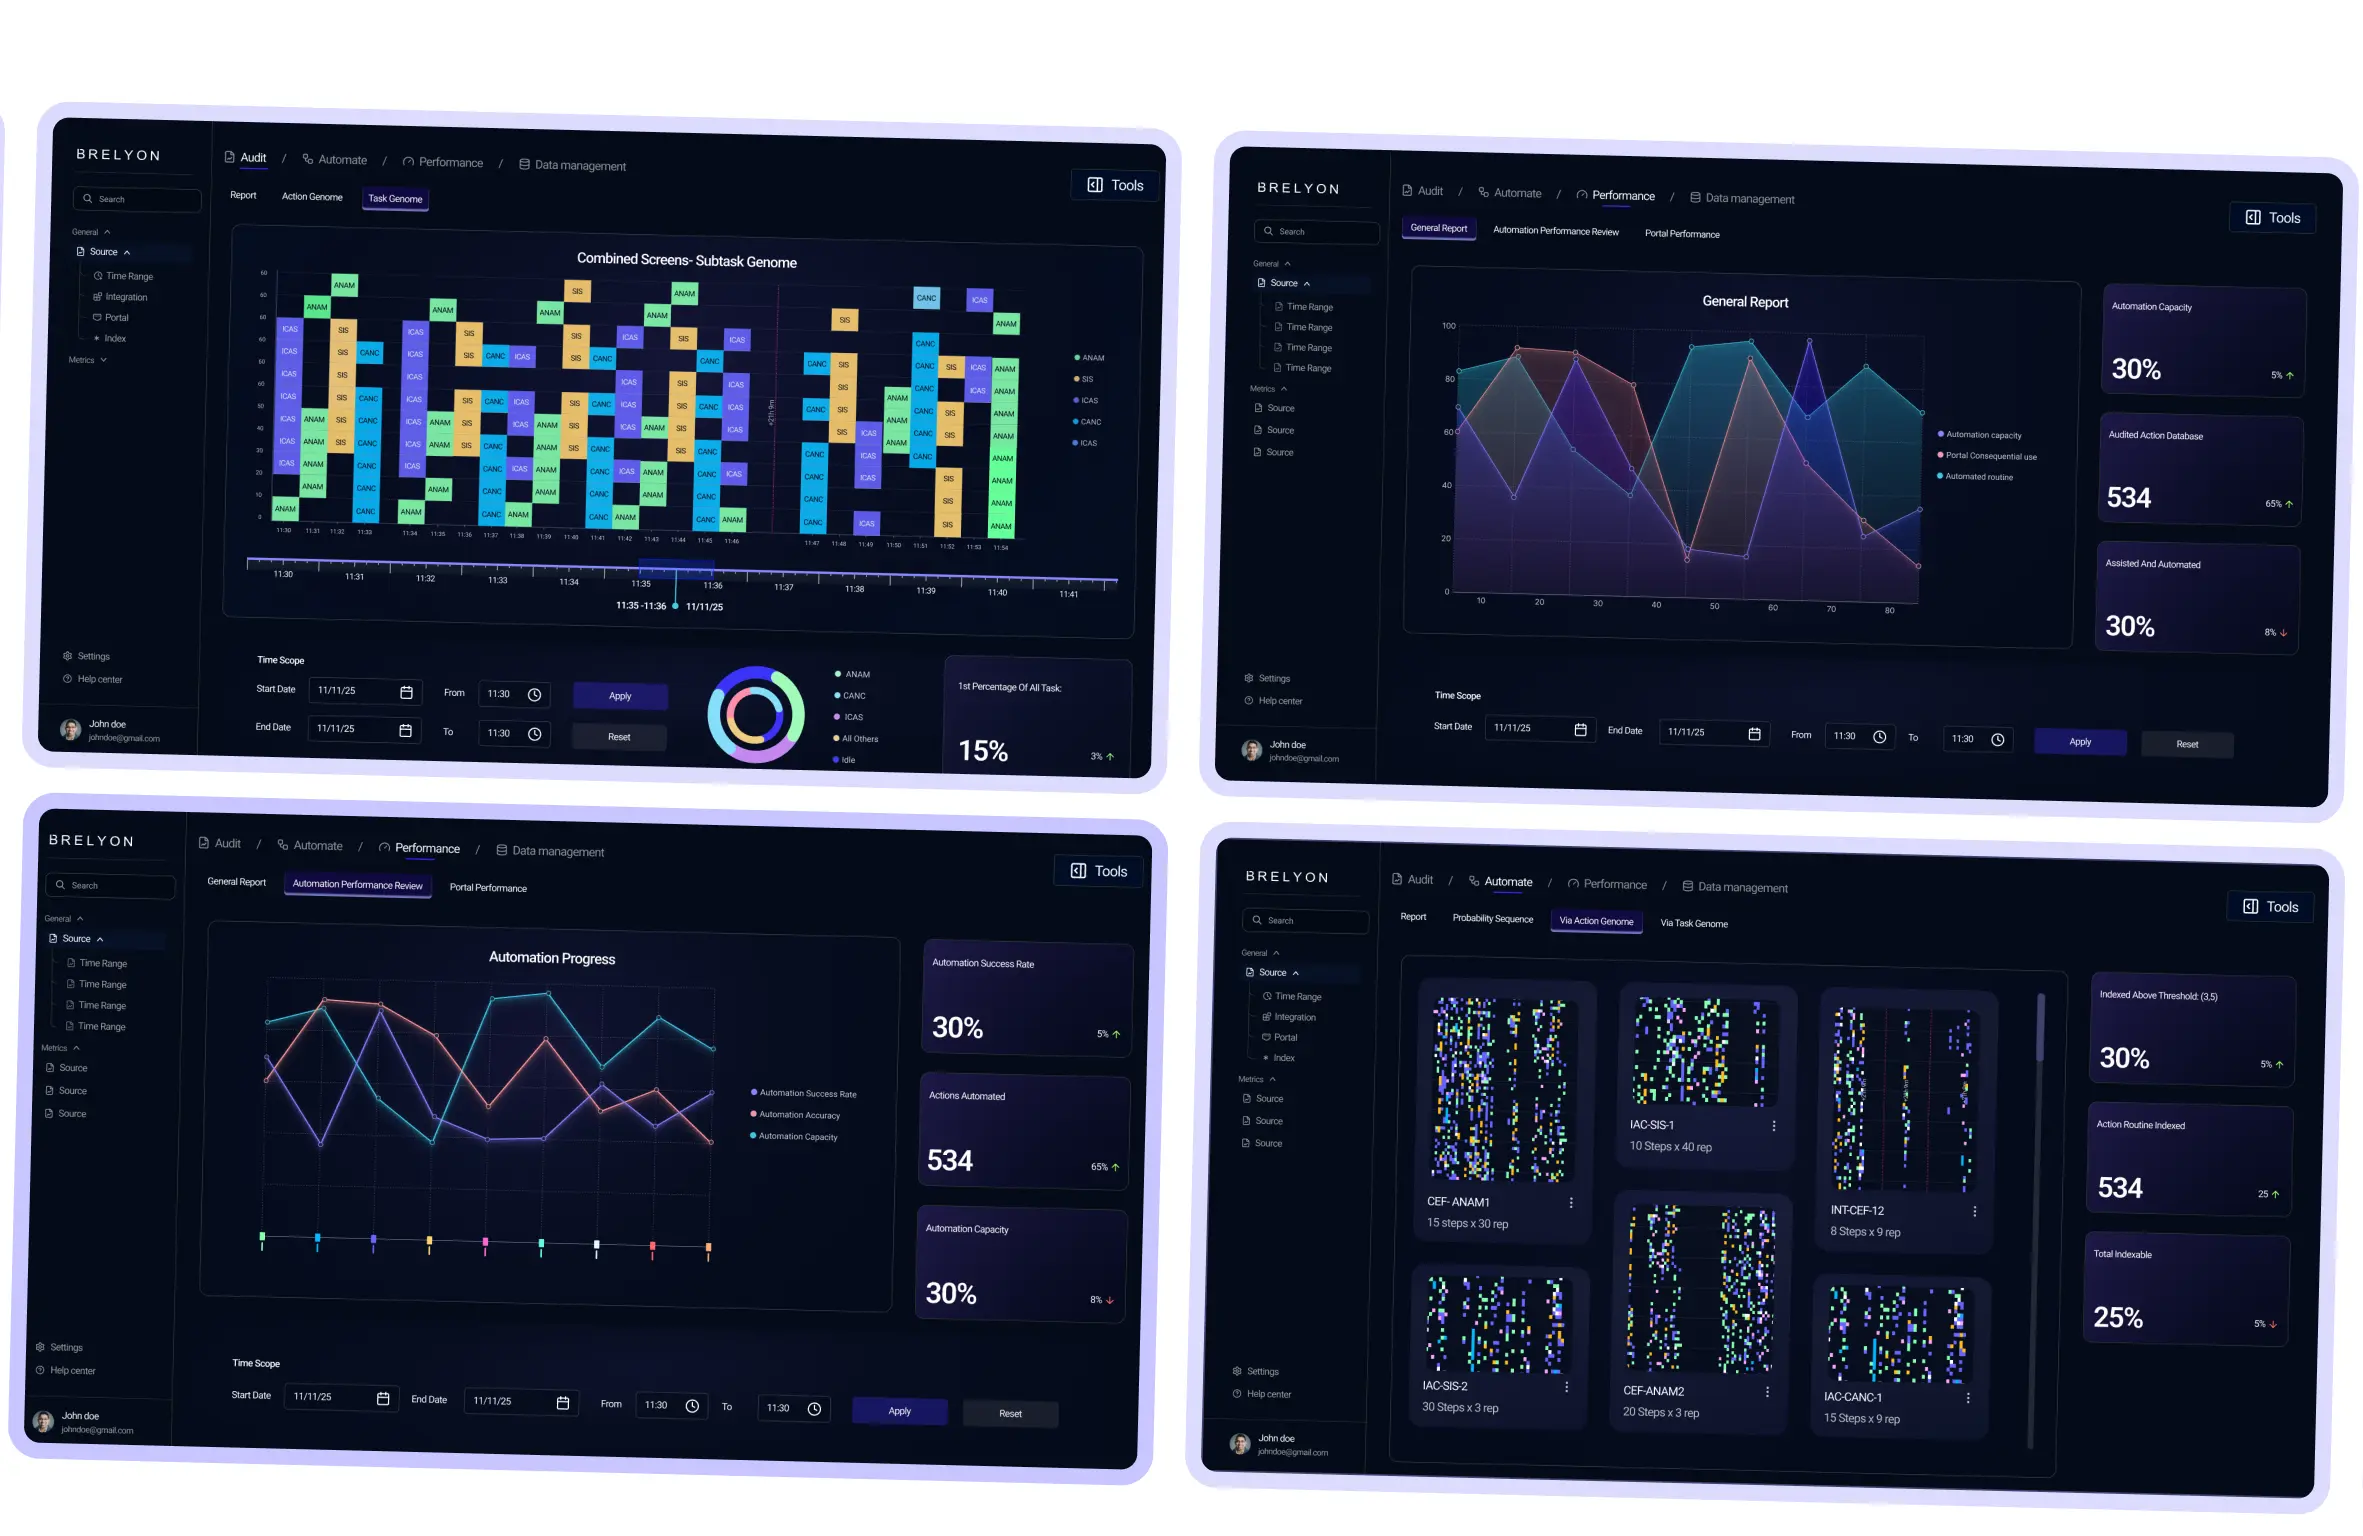
Founded in 2018 by MIT graduate Barmak Heshmat, Brelyon is a pioneer in immersive display technologies . while the company is known for its Ultra Reality headset - free displays, they've recently expanded into AI-powered software with Visual Engine, a platform that observes user behavior on screen, learns automation patterns, and generates real-time content augmentation. Visual Engine works independently across any display and application, targeting enterprise visualization portals, simulation training, and operations centers.
Brelyon's Visual Engine processes extremely dense, time-based behavioral data - thousands of user interactions, system events, and automation patterns layered across time, all on a single screen. The real challenge was interpretability. Analysts and decision-makers needed to trust what they were seeing, understand patterns quickly, and act without hesitation. Oversimplifying would strip away the precision the product was built for. Overcomplicating would make it unusable. Brelyon needed an interface that could hold technical depth while remaining clear to the people using it.
We began by understanding Brelyon's product vision and the role of the Visual Engine within their broader platform. The focus was on translating high-volume interaction data into parametric visualizations that could communicate both structure and scale. We built a modular interface system around floating panels and depth-based hierarchy. This allowed users to navigate complexity without losing context. Through iterative exploration, we established a consistent visual language and interaction patterns that support progressive disclosure. Dense data remained accessible but only visible when users needed it.
The goal was to design a scalable interface that makes complex behavioral and system data interpretable . By using parametric visualizations and structured analytics, the Visual Engine needed to help teams identify patterns, evaluate system efficiency, and make decisions with confidence . The interface also had to be built with future AI integration in mind, ensuring it could evolve as the platform grows.
“Business intelligence tools with data visualization capabilities offer an ROI of $13.01 for every dollar spent. "
The interface is built around floating panels and depth-based hierarchy. Information layers are organized spatially, allowing users to focus on what's immediately relevant while keeping the rest accessible. Panels can be moved, resized, and stacked based on workflow needs. The modular structure means the system can scale without cluttering the screen or forcing users into rigid layouts.
The Action Genome displays dense, time-based behavioral data where every color represents a data point. We designed a scrollable timeline with zoom and drag functionality, similar to video playback but for data. Users can view the entire dataset at once or zoom into specific time zones. Date and timeline selection is built directly into the interface, making it easy to navigate thousands of interactions without losing context.
A unified design language ensures clarity, usability, and confidence throughout the platform.
EdPrime redefines educational management with a user-centric ERP system, boosting engagement and operational efficiency in school settings.
Fastrack transforms e-commerce for youth with a vibrant, engaging UX, significantly reducing cart abandonment and increasing user interaction.